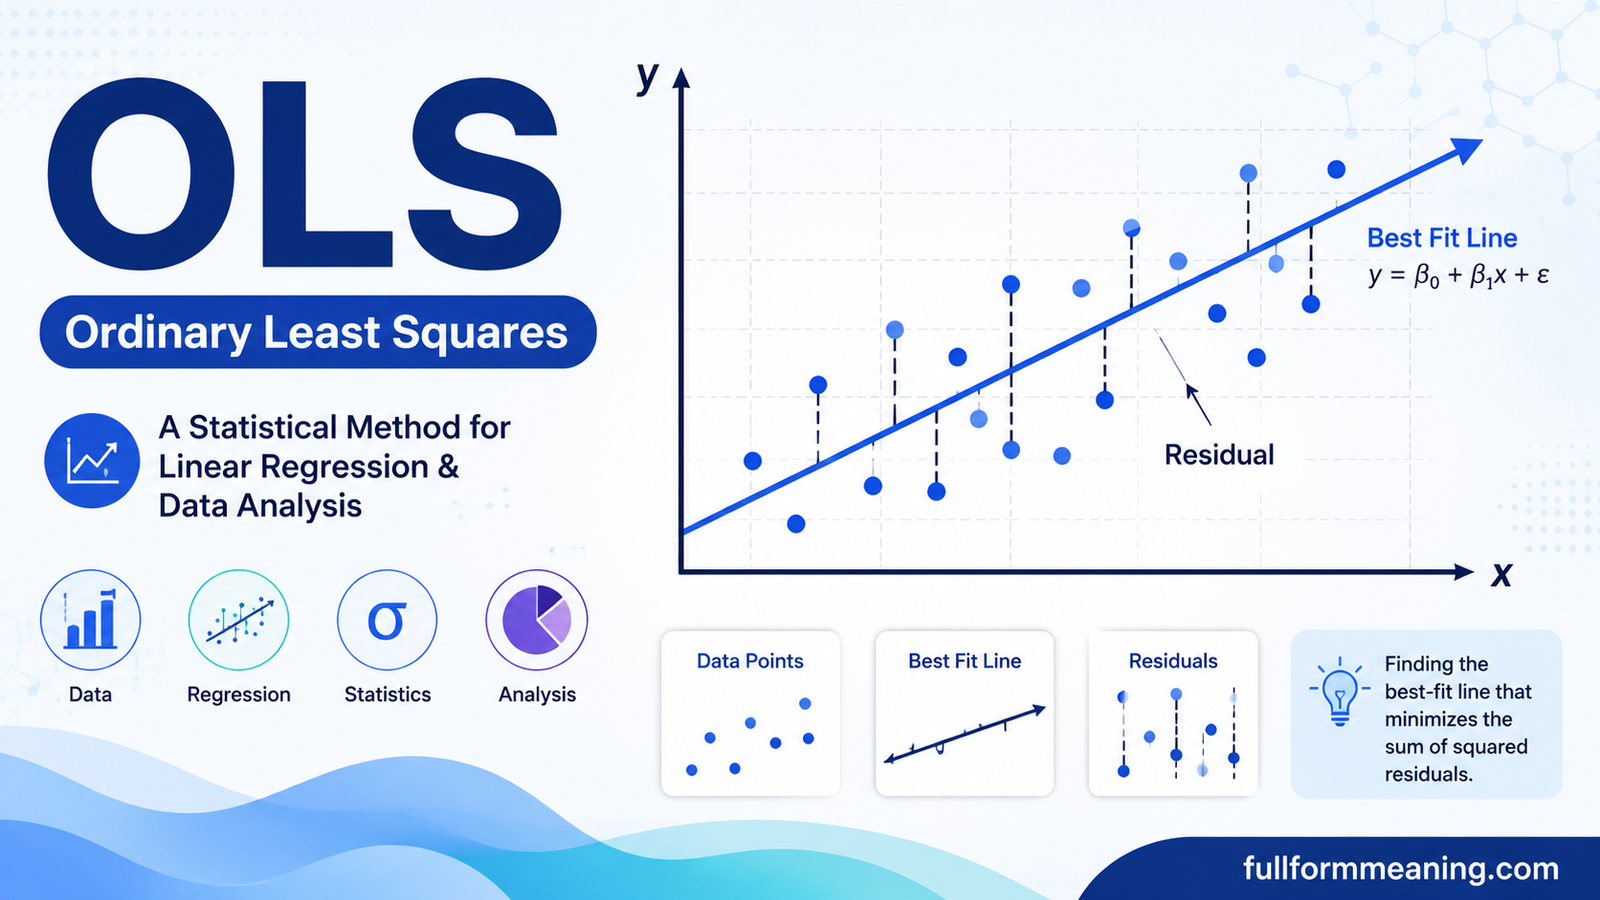
OLS: What Does OLS Stand For? Meaning & Uses
OLS full form is Ordinary Least Squares, a statistical method used to estimate the relationship between a dependent variable and one or more independent variables. It is widely use in linear regression, econometrics, data analysis, finance, business research, and scientific studies.
The method works by selecting model coefficients that minimize the total squared difference between the values predicted by a model and the values actually observed. Because of this approach, it provides a practical way to estimate relationships from data and measure how strongly different variables are associate.
Quick Answer
OLS full form: Ordinary Least Squares
| Term | Information |
| Full form | Ordinary Least Squares |
| Abbreviation | OLS |
| Main field | Statistics and mathematics |
| Common application | Linear regression |
| Main purpose | Estimating model parameters from data |
| Basic principle | Minimize the sum of squared residuals |
| Common users | Researchers, economists, analysts, scientists, and data professionals |
Although Ordinary Least Squares is the dominant meaning in statistics, the abbreviation can have different meanings in specialized fields. The exact interpretation therefore depends on the context.
What Does OLS Stand For?
OLS stands for Ordinary Least Squares. It is a method for estimating the unknown coefficients of a regression model.
In simple terms, imagine that you have data showing how advertising expenditure relates to sales. The observations will not normally fall perfectly on a single straight line. Some differences will occur because of other factors, measurement variation, or natural randomness.
The method attempts to find the line that provides the best overall fit according to the least-squares criterion. It does this by minimizing the sum of the squared residuals, where a residual is the difference between an observed value and the value predicted by the model. NIST describes this as minimizing the squared deviations associated with the fitted regression relationship.
OLS Meaning in Statistics
In statistics, Ordinary Least Squares is commonly used to estimate the parameters of a linear regression model.
A basic regression equation can be represented as:
Y = β₀ + β₁X + ε
Here:
- Y is the dependent or response variable.
- X is an independent or explanatory variable.
- β₀ is the intercept.
- β₁ represents the estimated effect associated with X.
- ε represents the error term.
With several explanatory variables, the model can include multiple coefficients. Statistical software packages commonly implement this approach as a regression procedure. For example, the current statsmodels documentation identifies its OLS model as Ordinary Least Squares and defines the dependent variable and explanatory variables used by the model.
How Does OLS Work?
The basic idea is easier to understand with an example.
Suppose a researcher records the number of hours students study and their examination scores. The researcher wants to determine whether study time is associated with higher scores.
The observations may look like this:
| Study Hours | Exam Score |
| 2 | 55 |
| 3 | 61 |
| 4 | 66 |
| 5 | 72 |
| 6 | 78 |
A regression model can estimate a line through these observations. The predicted score for each student will usually differ somewhat from the actual score.
The difference between an observed value and its predicted value is called a residual.
The method squares each residual and adds those squared values together. It then selects the coefficient values that produce the smallest possible total.
This objective can be expressed as:
Minimize Σ(yᵢ − ŷᵢ)²
The process is called “least squares” because it minimizes the sum of squared errors or residuals.
Why Are the Differences Squared?
Squaring the residuals serves several purposes.
First, positive and negative differences cannot simply cancel each other out. Second, larger errors receive greater mathematical weight than smaller errors. This encourages the fitted model to avoid unnecessarily large deviations.
For example, a residual of 2 has a squared value of 4, while a residual of 6 has a squared value of 36. Therefore, a large prediction error has considerably more influence on the objective being minimized.
Where Is OLS Used?
Ordinary Least Squares is widely used across disciplines because many research questions involve estimating relationships between variables.
Economics and Econometrics
Economists use regression models to study relationships involving income, employment, inflation, consumption, production, interest rates, and other economic variables.
For example, an economist might estimate how changes in household income are associated with consumer spending.
Business and Finance
Businesses can use regression analysis to study sales, advertising performance, pricing, customer behavior, and financial variables.
A company could estimate the relationship between promotional spending and monthly sales while controlling for other explanatory variables.
Scientific Research
Researchers use regression models to analyze experimental and observational data. The method can help quantify associations and estimate model parameters.
Data Science
OLS is also an important foundation for statistical modeling and machine-learning workflows involving continuous outcomes. Modern statistical software provides tools for fitting regression models and examining statistics such as coefficients and R-squared.
What Are the Main Outputs of an OLS Model?
After fitting a regression model, analysts commonly examine several results.
Coefficients
Coefficients indicate how the estimated outcome changes with the explanatory variables, holding the other included variables constant.
Intercept
The intercept represents the model’s predicted outcome when the explanatory variables equal zero, provided that interpretation makes sense for the data.
Residuals
Residuals show the difference between observed and predicted values. Examining them can help identify problems with model fit.
R-Squared
R-squared measures the proportion of variation in the dependent variable explained by the fitted regression model when the conventional intercept-based definition applies. NIST documents R-squared among standard regression quantities.
Standard Errors and Test Statistics
Regression output can also provide standard errors, t-statistics, p-values, confidence intervals, and other measures used to assess estimated coefficients. Statistical software such as statsmodels reports these quantities in its regression results.
Important Assumptions
The quality and interpretation of a regression model depend on the characteristics of the data and the assumptions behind the statistical analysis.
Important considerations include:
- Appropriate model specification — The model should reasonably represent the relationship being studied.
- Independence of errors — Error terms should have an appropriate independence structure for the intended analysis.
- Constant error variance — In the standard setting, the variance of errors is assumed to remain constant.
- Limited problematic multicollinearity — Strong relationships among explanatory variables can make coefficient estimates unstable.
- Appropriate treatment of influential observations — Extreme observations can substantially affect fitted coefficients.
- Exogeneity conditions — The explanatory variables need an appropriate relationship with the error term for standard coefficient interpretation.
Normality of errors is often discussed in connection with statistical inference, but it is important to distinguish assumptions needed for coefficient estimation from assumptions used to justify particular small-sample tests and confidence intervals.
Advantages of OLS
The method remains popular for several reasons.
- It is mathematically well established.
- It is relatively straightforward to understand.
- It can handle multiple explanatory variables.
- It produces interpretable regression coefficients.
- It is available in many statistical and programming tools.
- It provides a useful framework for hypothesis testing and prediction.
- It forms an important foundation for more advanced regression techniques.
The approach can also be computationally efficient for many ordinary regression problems.
Limitations of OLS
Despite its usefulness, Ordinary Least Squares is not suitable for every dataset or research question.
Large outliers can strongly influence the fitted model because residuals are squared. Strong multicollinearity can also make coefficient estimates unstable. If the relationship is poorly specified, a mathematically successful fit may still provide a misleading interpretation.
Another important limitation concerns measurement error in explanatory variables. When predictors contain substantial measurement error, the standard regression approach can produce biased estimates under common conditions. NIST discusses this issue when comparing ordinary least-squares fitting with methods designed for errors in both variables.
For these reasons, analysts should examine the data, model specification, residual behavior, and assumptions rather than treating a regression result as automatically reliable.
OLS vs WLS vs GLS
Several regression methods have names that look similar but address different modeling situations.
| Method | Full Form | Main Idea |
| OLS | Ordinary Least Squares | Standard least-squares regression |
| WLS | Weighted Least Squares | Gives observations different weights |
| GLS | Generalized Least Squares | Accounts for a specified error covariance structure |
| GLSAR | Generalized Least Squares with Autoregressive Errors | Handles certain autocorrelated error structures |
Statistical documentation distinguishes these approaches according to the properties of the error structure and the way observations are modeled.
The important point is that these abbreviations should not be treated as interchangeable. The appropriate method depends on the characteristics of the data and the assumptions of the analysis.
Other Meanings of OLS
Although Ordinary Least Squares is the principal statistical meaning, OLS can represent other terms in specialized contexts.
One example is Optical Line System, a telecommunications term associated with optical networking. In that context, the abbreviation refers to network equipment or a system used in optical communications rather than a statistical method.
Another possible expansion is Online Learning System, which can appear in education and technology contexts. Because acronym usage varies between organizations and industries, the surrounding subject is important when interpreting the abbreviation.
Therefore, seeing the three letters alone does not always provide enough information to determine the intended meaning.
Common Mistakes About OLS
One common mistake is assuming that a high R-squared automatically proves that a model is correct. A strong fit statistic does not by itself establish causation, correct specification, or reliable predictions outside the observed data.
Another mistake is interpreting a coefficient as a causal effect without considering the research design and possible confounding factors.
It is also incorrect to assume that every regression problem should use the same method. Weighted least squares, generalized least squares, robust methods, nonlinear models, or other approaches may be more appropriate in particular situations.
Key Takeaways
- OLS full form is Ordinary Least Squares.
- It is primarily associated with statistics, regression analysis, econometrics, and data analysis.
- The method estimates regression coefficients by minimizing the sum of squared residuals.
- It can be used with one or multiple explanatory variables.
- Regression output may include coefficients, residuals, R-squared, standard errors, and statistical tests.
- Model assumptions and data quality are important when interpreting results.
- OLS is not the same as WLS or GLS.
- The abbreviation can have other meanings in telecommunications, education, and specialized fields.
- The correct interpretation should always be determined from context.
FAQs About OLS
What does OLS mean in statistics?
In statistics, it refers to a method that estimates regression coefficients by minimizing the sum of squared differences between observed and predicted values.
What is the main purpose of OLS?
Its main purpose is to estimate the parameters of a regression model and describe the relationship between a dependent variable and explanatory variables.
Is OLS the same as linear regression?
Not exactly. Linear regression is a type of statistical model, while Ordinary Least Squares is a common method used to estimate the parameters of a linear regression model.
What is an OLS regression model?
It is a regression model whose coefficients are estimated using the least-squares criterion. The method can be applied to simple or multiple linear regression.
What does the “least squares” part mean?
It means that the estimation procedure chooses model parameters that minimize the sum of squared residuals between observed and predicted values.
Conclusion
OLS is one of the most important concepts in regression analysis. Its full form, Ordinary Least Squares, describes a method for estimating model parameters by minimizing the squared residuals between observed and predicted values. Its applications span economics, business, finance, science, statistics, and data analysis.
Understanding the basic idea is straightforward: given a set of observations, the method searches for coefficient values that provide the best fit according to the least-squares criterion. However, interpreting the resulting model requires more than looking at a fitted line or a single statistic. Data quality, model specification, assumptions, outliers, and the distinction between association and causation all matter.
When the abbreviation appears outside statistics, its meaning can change. Terms such as Optical Line System and Online Learning System demonstrate why context should always be considered when interpreting an acronym.